01
Reconstruct
A real urban site, rebuilt from whatever exists: satellite imagery, drone footage, phone video. Public LiDAR fills in the ground.
Satellite imageryDrone footagePhone videoPublic LiDAR
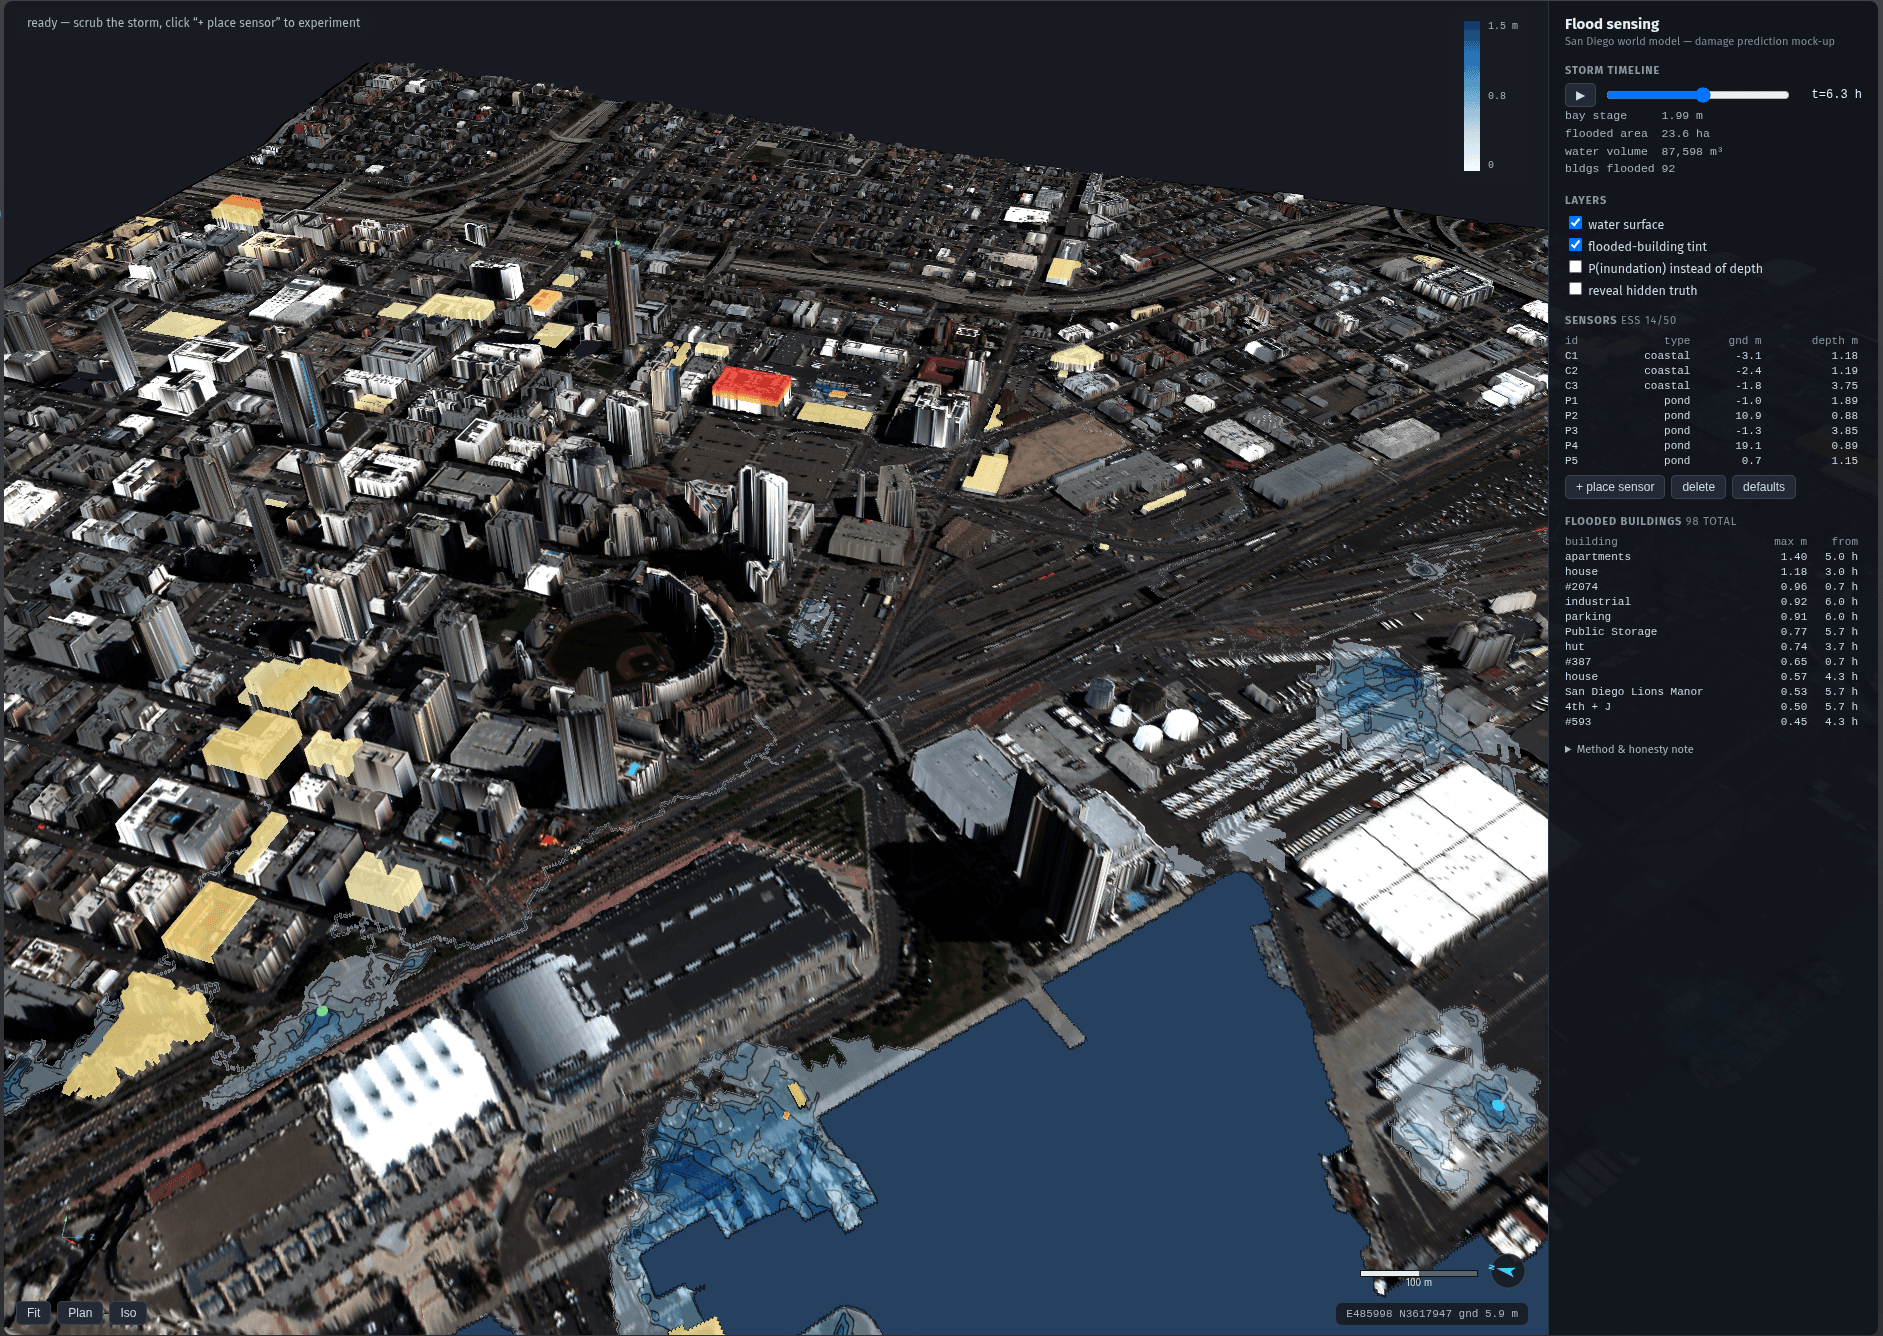
We reconstruct a city from the footage that already exists, then play the storm forward over it: which buildings take water, when, and how deep.
Storm · hour 6.3
23.6 ha · 87,598 m³
How it works
Flood prediction runs on the model we already build for damage assessment, so the city that floods is the one that gets measured and priced afterwards.
01
A real urban site, rebuilt from whatever exists: satellite imagery, drone footage, phone video. Public LiDAR fills in the ground.
02
The storm plays forward over the reconstructed city, so water runs down the streets that are actually there and around the buildings that are actually there.
03
During a live event, the model takes in whatever sensing there is and updates the picture. It does not depend on a gauge network being there.
04
Every structure gets a maximum-inundation figure: how deep the water gets at it and when it arrives, ready to rank.
San Diego
Downtown San Diego, reconstructed from satellite imagery with public LiDAR for the ground. On the right, the sensors feeding the model and the flooded buildings, each with its depth and time of arrival.
What it is for
Rescue triage
A ranked list of the structures taking the most water and when it reaches them, so crews go first where they are needed most.
Recovery cost estimates
The same per-structure depths feed the repair estimate, on the model the damage assessment already uses.
Validation
Validated on a past flash flood against high-water marks held out of the model.
Get started
Bring us the imagery a city already has. We reconstruct it and play the storm forward over it.